Learn key data normalization techniques—Min-Max, Z-Score, Log, and more. See practical examples with Python for preparing clean, scalable data
Introduction
Data normalization is a vital preprocessing step in data science, machine learning, and analytics. When features in a dataset have vastly different scales, it can lead to biased models or poor performance. Normalization transforms data to a common scale, improving model accuracy and training stability.
In this blog, we’ll explore common normalization techniques with examples and Python code to demonstrate their real-world use.
Why Normalize Data?
Machine learning models like KNN, SVM, and neural networks are sensitive to feature scales. For example:
- A model using both “age” (0–100) and “income” (0–100,000) might treat income as far more important.
- Gradient descent can converge faster on normalized data.
Normalization solves these problems by rescaling features.
1. Min-Max Normalization (Rescaling)
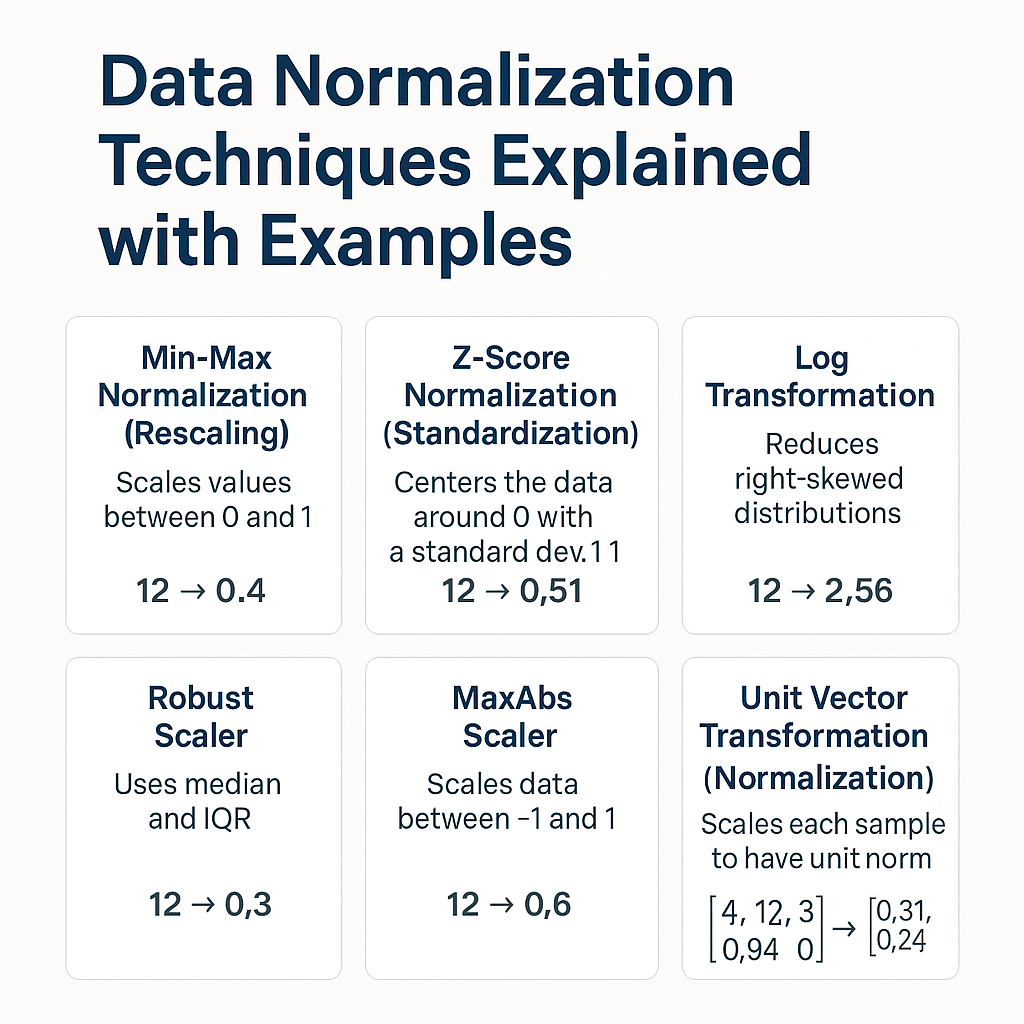
X norm = (X−X min)/(X max - X min)Scales values between 0 and 1.
Use case: Useful when you want a bounded range (e.g., 0–1).
from sklearn.preprocessing import MinMaxScaler
import numpy as np

data = np.array([[100], [200], [300], [400]])
scaler = MinMaxScaler()
normalized = scaler.fit_transform(data)

print(normalized)
2. Z-Score Normalization (Standardization)
Formula:
X standard = X - μ / σCenters the data around 0 with a standard deviation of 1.
Use case: When data follows a Gaussian distribution.
from sklearn.preprocessing import StandardScaler

data = np.array([[100], [200], [300], [400]])
scaler = StandardScaler()
standardized = scaler.fit_transform(data)

print(standardized)
3. Log Transformation
Formula:
X log =log(X+1)Reduces right-skewed distributions.
Use case: Data with exponential growth or heavy skew.
import numpy as np

data = np.array([1, 10, 100, 1000])
log_transformed = np.log1p(data)

print(log_transformed)
4. Robust Scaler
Uses median and IQR (Interquartile Range) instead of mean and standard deviation.
Use case: When data contains many outliers.
from sklearn.preprocessing import RobustScaler

data = np.array([[1], [2], [3], [100]])
scaler = RobustScaler()
robust_scaled = scaler.fit_transform(data)

print(robust_scaled)
5. MaxAbs Scaler
Scales data between -1 and 1 based on maximum absolute value.
Use case: Sparse data or data already centered.
from sklearn.preprocessing import MaxAbsScaler

data = np.array([[1], [2], [-3], [4]])
scaler = MaxAbsScaler()
maxabs_scaled = scaler.fit_transform(data)

print(maxabs_scaled)
6. Unit Vector Transformation (Normalization)
Scales each sample (row) to have unit norm (magnitude of 1).
Use case: Text classification (TF-IDF), cosine similarity.
from sklearn.preprocessing import Normalizer

data = np.array([[4, 3, 2]])
scaler = Normalizer()
normalized = scaler.fit_transform(data)

print(normalized)
When to Use What?
| Technique | Best For | Sensitive to Outliers? |
|---|---|---|
| Min-Max | Bounded features, e.g., neural nets | Yes |
| Z-Score | Gaussian-like data | Yes |
| Log Transform | Skewed data, exponential ranges | Yes |
| Robust Scaler | Data with outliers | No |
| MaxAbs Scaler | Sparse data, zero-centered | Yes |
| Unit Vector | Cosine-based models, NLP | Yes |
Conclusion
Data normalization is more than just a preprocessing formality—it’s a foundational technique that can dramatically improve the performance of your machine learning models. By choosing the right normalization method based on your data characteristics and model type, you set the stage for better accuracy, convergence, and insight.
Next Steps:
- Explore your dataset’s distribution before picking a technique.
- Combine normalization with feature engineering.
- Try different scalers and compare model performance.